Work Stealing Simulator
Worl Stealing on one cluster
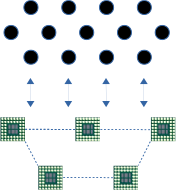
In our Work, we are interested in Work stealing algorithm with an explicit latency on a one cluster topology. In our model, the processor are linked via a not uniform interconnection network. And the processors communicate through this interconnection network. Thus, we consider that communications are explicit (latency or bandwidth) and costly
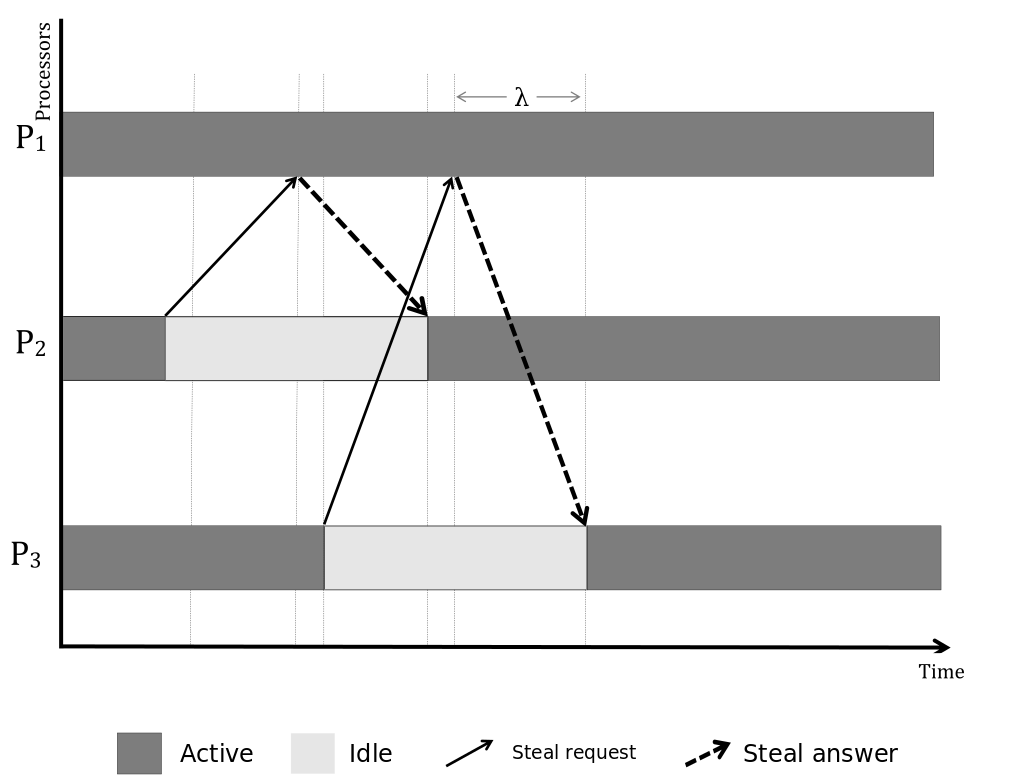
In the first step, we consider the model with communication latency. The simulator is able to run simulations to analyse the impact of the latency on the Makepane.
This page describes the adequate configurations and the steps needed to run the simulation on One-cluster
Simulation With WS-Simulator
To run simulation, you can follow the steps described in Download and use WS-Simulator
Case study : Validation the theoretical analysis
In Order to reproduce the simulation used in Analysis of Work Stealing with latency, the scripts are available on github.
Here, we explain how we can reproduce the simulation and trace the comparison (between theoretical and experimental) results in boxplot format.
Recall that the simulator is developed in PYTHON, So to use the simulator you need to install Python3.5. If you don't have the simulator, clone it:
~/ $ git clone git@github.com:wssimulator/simulator.git
The scripts are in one-cluster/scripts :
~/simulator/one-cluster/scripts $  ls
  genere_boxp_data.sh  Makefile     one-cluster-simulations.sh
  genere_ratioWP.sh    makefile.in  result_formula.gnu
We can use makefile.in to configure our simulation. for example to run 200 simulations for latency=500, we can do :
~/simulator/one-cluster/scripts $ make simule RUN=1000 LATENCY=500
Then, once the simulation finish, we can find the results in : ~/simulator/one-cluster/data/data-from-simulator/"
~/simulator/one-cluster/data/data-from-simulator/ $ ls
   one-cluster-latency-128  one-cluster-latency-32
   one-cluster-latency-256  one-cluster-latency-64
Next, you need to use genere_boxp_data.sh to prepare data for boxplot format, this script computes the ratio between the theoretical bound and the simulation results as described in Analysis of Work Stealing with latency
You can use makefile to perform this step :
~/simulator/one-cluster/scripts $ make prepar-boxp-data RUN=1000 LATENCY=500
Then, you can use gnuplot to trace boxplot figures. you can use the script result_formula.gnu or use the makefile command as:
~/simulator/one-cluster/scripts $ make trace-comparaison RUN=1000 LATENCY=500